FIGURE 12.
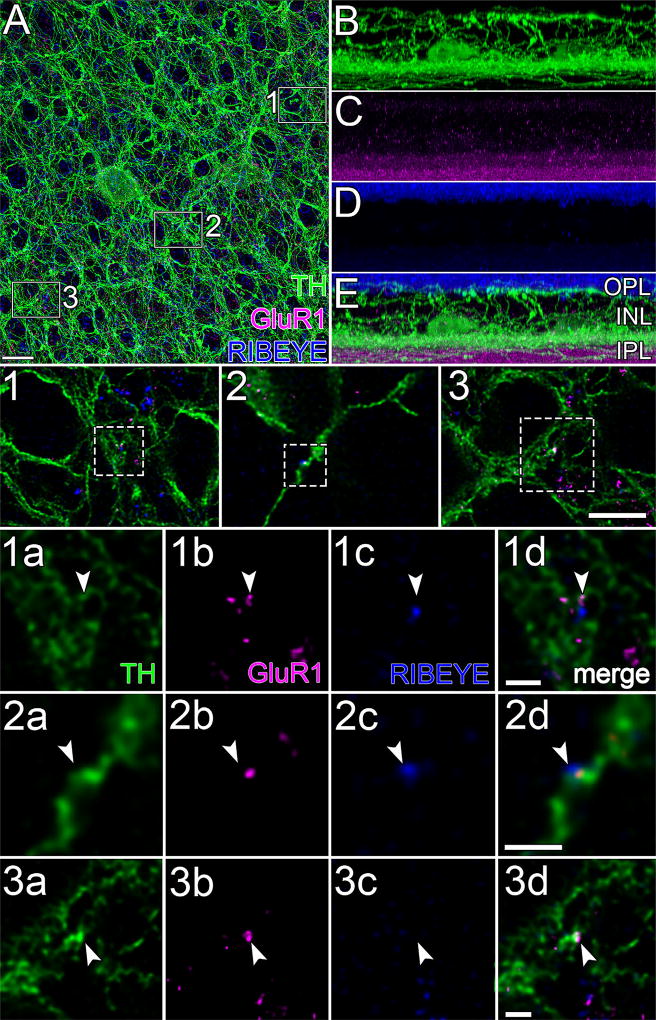
GluR1 and RIBEYE. (A) Projection of 183 optical sections (thickness = 36.56 µm) through the INL and IPL of flat-mounted retina immunostained for TH (green), GluR1 (magenta), and RIBEYE (blue), oversampled, and deconvolved. Note the characteristic TH “rings” formed by TH neurites that surround round, TH-immunonegative areas (Pourcho, 1982; Voigt & Wässle, 1987). Magenta and blue dots within these rings are at different focal planes. (E) 90 ° rotation of A. (B–D) Views of E in each of the color channels. TH cell somata are faint but visible at proximal edge of the INL to the right and left of the center of B. Arborization of TH cell neurites in the OPL, INL, and IPL are more evident than in Figure 3 due to difference in thickness of tissue displayed. GluR1 signal (C) is heaviest in the proximal IPL but is also present in the distal IPL, INL, and OPL. RIBEYE signal (D) is heaviest at the level of rod axon terminals but is also present in the IPL. Areas marked by boxes in A are displayed at intermediate magnification in panels 1 to 3, and at higher magnification in panels 1a to 3d, one row per box. Each row displays a single optical section, viewed in different color channels. Panels 1a to 3a, 1b to 3b, and 1c to 3c display TH (green), GluR1 (magenta), and RIBEYE (blue) signals, respectively. Merges show apposition of RIBEYE to GluR1 colocalized on TH (1d, 2d) and a colocalization of GluR1 and TH without nearby RIBEYE (3d). Arrowheads point to identical positions in panels of each column. Scale bar = 10 µm in A (applies to A–E); 7 µm in 3 (applies to 1–3); 1 µm in 1d, 2d, and 3d (apply to 1a–1d, 2a–2d, and 3a–3d, respectively)

