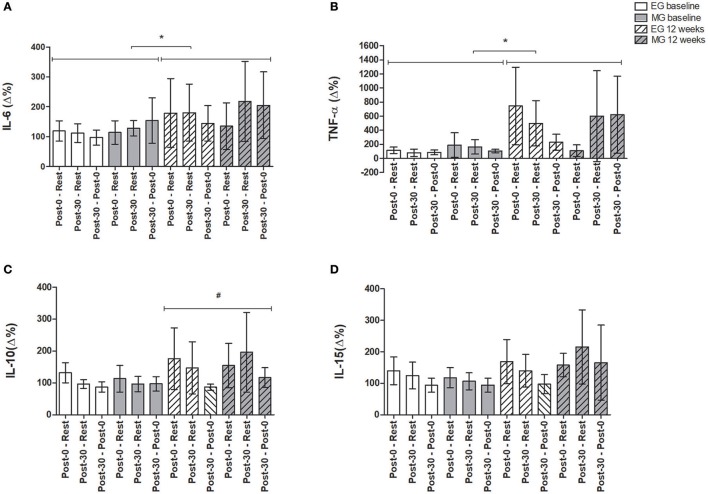
Figure 3.
Analysis of inflammatory parameters (Δ%) in acute exercise session at baseline and 12 weeks after training protocol. Data expressed as mean and 95% confidence interval. (A) Interleukin 6, IL-6 (pg/mL); (B) Tumor necrosis factor-alfa, TNF-α (pg/mL); (C) Interleukin 10, IL-10 (pg/mL); (D) Interleukin 15, IL-15 (pg/mL). Post-0—Rest: difference between immediately post- exercise session and rest; Post-30—rest: difference between 30 min post- exercise and rest. Post-30—Post-0: difference between 30 min post- exercise and immediately post- exercise session. *Significant differences between conditions between acute exercise at baseline and after 12 weeks (bout 1 vs. bout 2); #Significant main effect of time (Rest, Post-0, and Post-30). In the comparisons between acute exercise at baseline and after 12 weeks of exercise training; EG: n = 24; MG: n = 11. Statistical test used: A Mauchly's test of sphericity was used to test this assumption, and a Greenhouse-Geisser correction was applied when necessary. A three-way analysis of variance were used to compare group (EG × MG), condition (baseline = bout 1 × after 12 weeks of training = bout 2) and time [Rest, immediately post-exercise (Post-0), and 30 min post- exercise (Post-30)] was conducted to verify the inflammatory and metabolic responses in the acute exercise sessions between groups. Finally, delta values was conducted (Immediately post-exercise minus Rest; 30 min post- exercise minus Rest and 30 min post- exercise minus Immediately post-exercise, all values were divided by rest and multiplied by 100 = Δ%).

