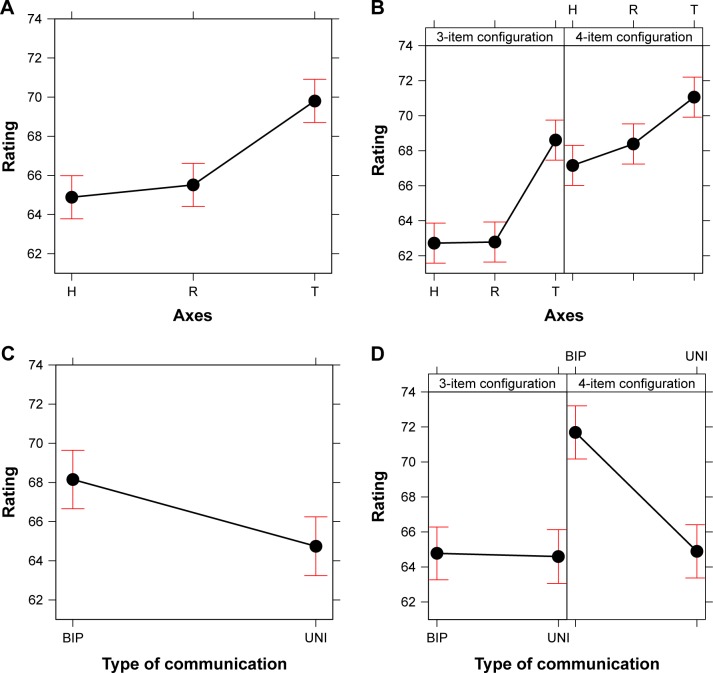
Figure 3.
Effects of axes (H, R and T) and type of communication (BIP; UNI) on the ratings. The main effects are reported in (A and C). The interactions of each effect with configuration type (3-item, 4-item configuration) are shown in (B and D). Error bars represent a 95% confidence interval.
Abbreviations: BIP, bipolar; H, health; R, risk; T, commitment to the treatment; UNI, unipolar.

