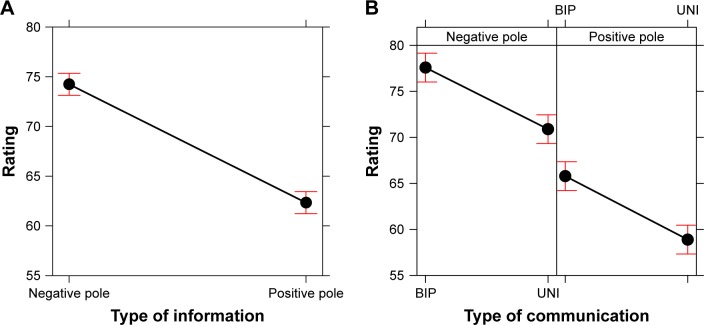
Figure 4.
Plot of the main effect of type of information (negative pole, positive pole) on the ratings given by participants (A) and the interaction between type of communication (BIP, UNI) and type of information (B). Error bars represent a 95% confidence interval.
Abbreviations: BIP, bipolar; UNI, unipolar.

