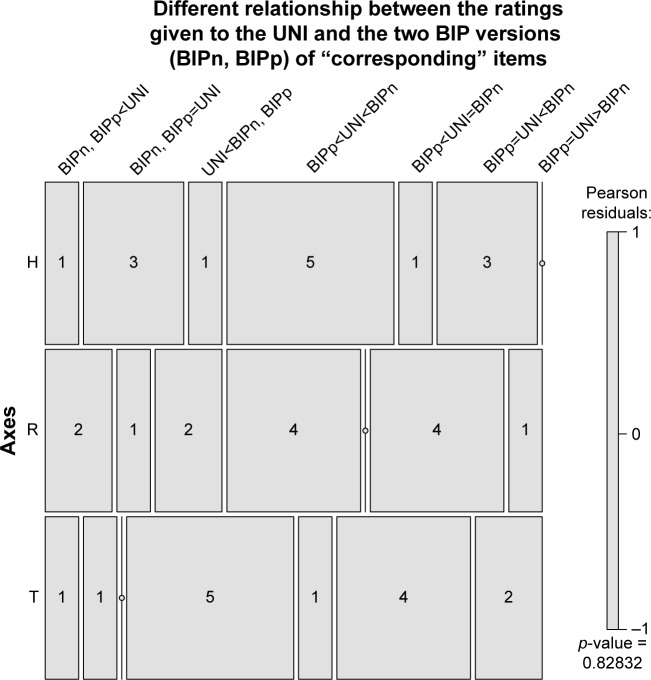
Figure 7.
Mosaic plot showing the frequency of the seven outcomes of the matching between corresponding items in the BIP and UNI polar versions of the questionnaire, with 3-item configurations. Fourteen matches were studied for each axis (H, R and T).
Abbreviations: BIP, bipolar; BIPn, bipolar negative; BIPp, bipolar positive; H, health; R, risk; T, commitment to the treatment; UNI, unipolar.

