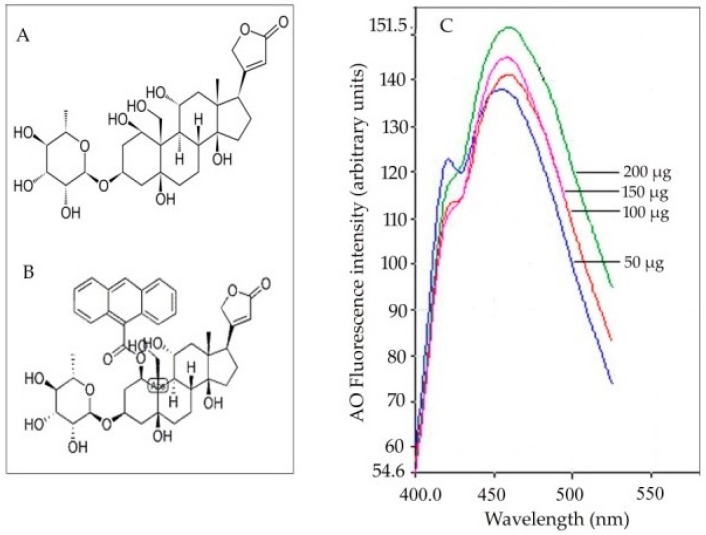
Figure 3.
(A) Chemical structure of ouabain and (B) its fluorescent derivative 9-anthroylouabain. (C) Dose-dependency (protein concentration ranging from 50 to 200 µg) of fluorescence intensity obtained from the fluorescence emission spectra due to OU-sensitive ATPase binding to 9-anthroylouabain (ex. 365 nm, em. 460 nm) [85].

