Figure 5.
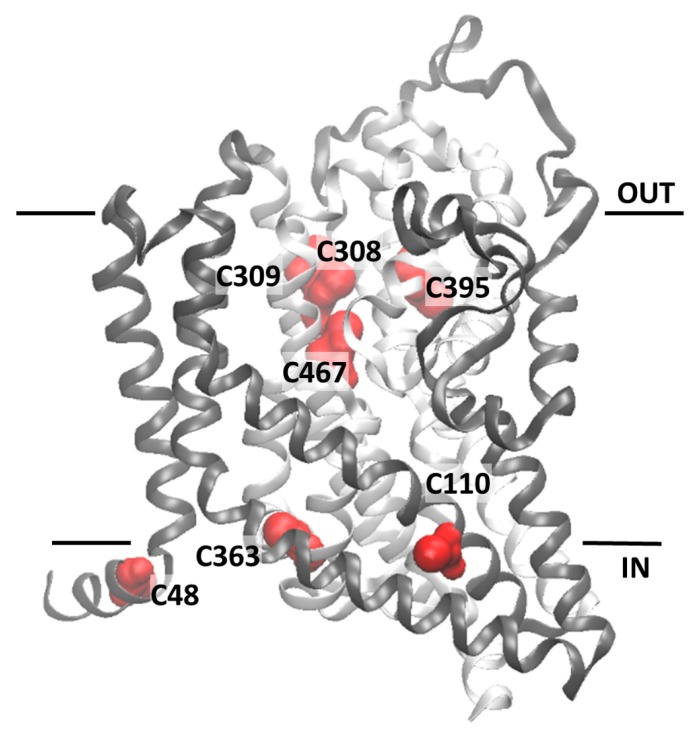
Homology structural model of the hASCT2. The model was obtained using the crystallographic structure of EAAT1 (PDB 5LLU) as template (Section 4.5). Panel shows the ribbon diagram highlighting 7 out of the 8 Cys residues of the human ASCT2 which are depicted in red; C308, C309, C395 and C467 are located in the core of the protein named “elevator” which is represented in light gray. C48, C110 and C363 are located in external α-helices depicted in dark gray. The homology model was represented using the molecular visualization program VMD. Models were generated by different types of software. The one depicted in the figure, from Swiss Model, represents the best compromise between the sequence coverage (83%) and number of amino acids (95%) falling in the favored region of the Ramachandran plot.

