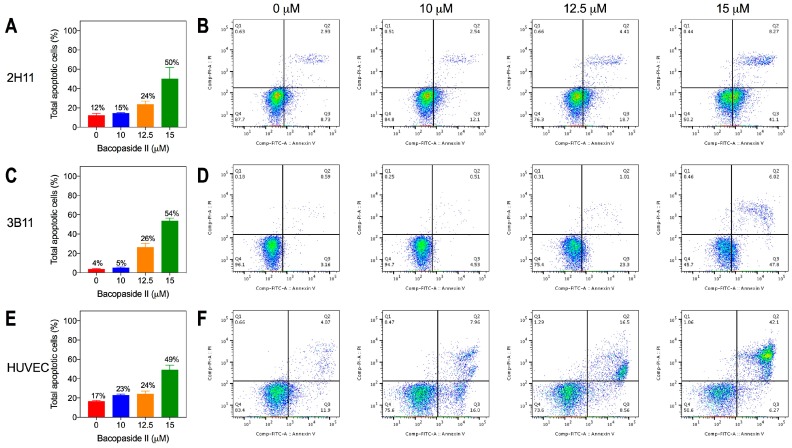
Figure 3.
Bacopaside II increased endothelial cell apoptosis as determined by flow cytometry. Histograms (left) show percentages of apoptotic cells (early and late) in a representative experiment for data shown in the scatter plots at the different concentrations of bacopaside II. Results are shown for 2H11 (A,B), 3B11 (C,D) and HUVEC (E,F). In (A,C,E), results shown as the mean ± SD; in (B,D,F), scatter plots show population gates of viable cells (left lower quadrant), or cells either in early apoptosis (right lower quadrant), late apoptosis (right upper quadrant), or necrosis (left upper quadrant).

