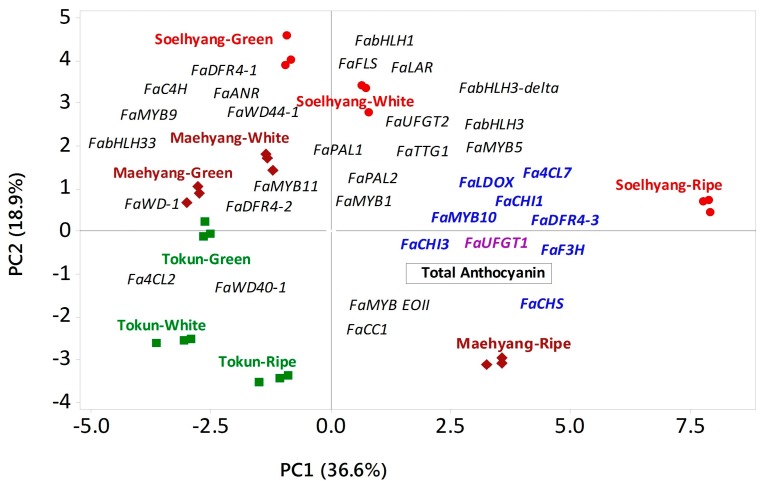
Figure 5.
Biplot showing the association between the regulatory and biosynthetic genes with the total anthocyanin in three fruit developmental stages, namely, green, white and ripe fruits, of Fragaria × ananassa fruit as determined by Principal Component Analysis (PCA). The three varieties are shown in three different shapes and colors as positioned by their respective mean PC scores in PCA biplot. The total anthocyanin (shown in rectangular box) and the genes represent coefficients between PC1 and PC2. The most contributing genes in accumulating higher anthocyanin in ripe fruits of cultivars, Maehyang and Soelhyang, are shown by bold letters. PC, Principal Component.

