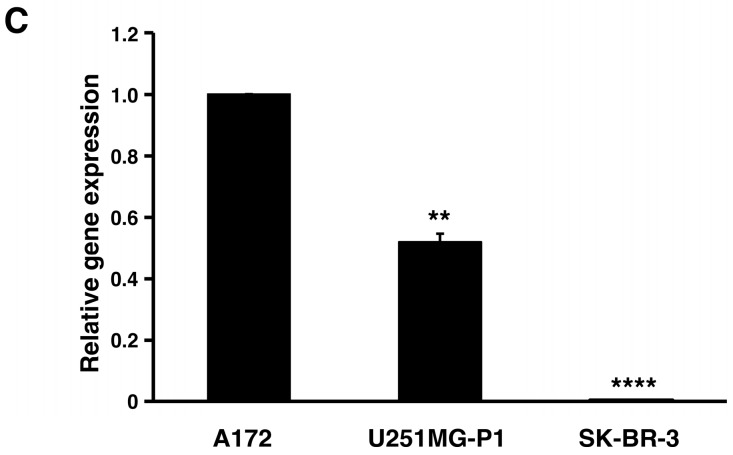
Figure 2.
The U251MG-P1 cells are expressing MMP-2. (A) Western blot of cells with anti-MMP-2 and anti-beta-actin antibodies. (B) Relative intensity of the bands in Western blot densitometrically analyzed by ImageJ. (C) Relative gene expression analyzed by reverse transcription quantitative PCR. The data presented as the mean ± SD (n = 3) from three independent experiments. The data were analyzed by two-tailed students t-test using A172 cells as a control; **, p < 0.01; ****, p < 0.001.


