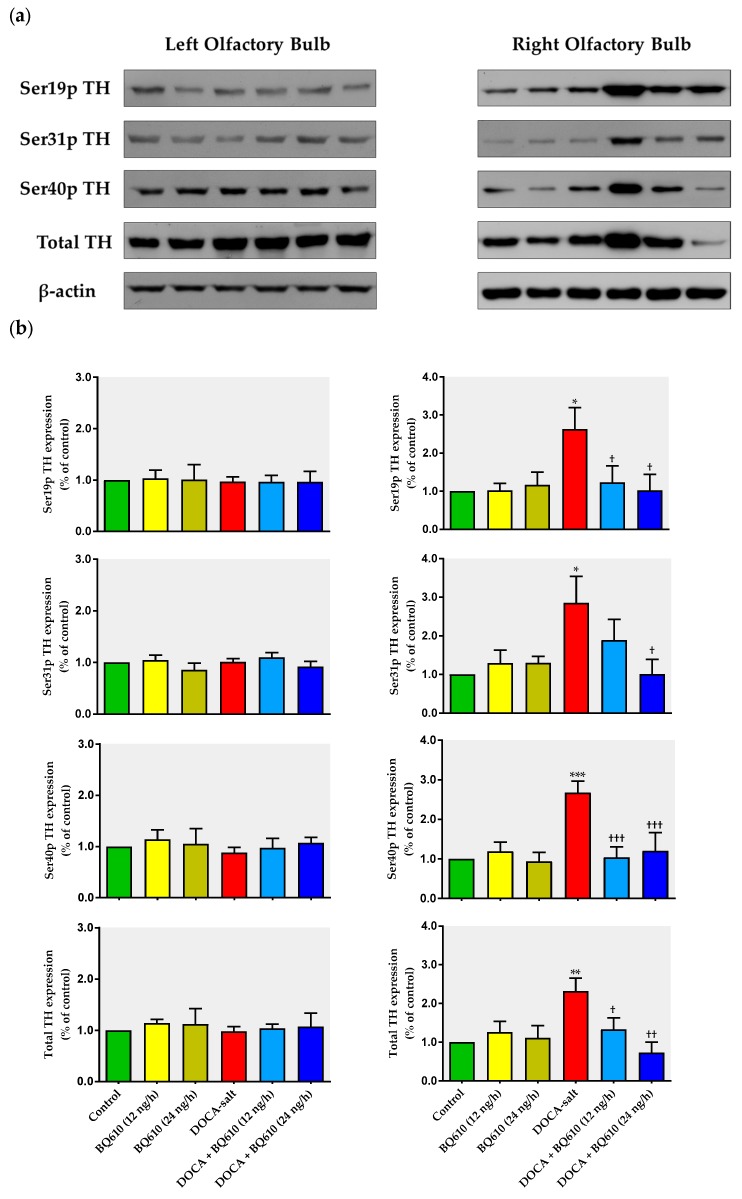
Figure 4.
Expression of total tyrosine hydroxylase (TH) and its phosphorylated forms following ETA blockade in the left and right olfactory bulb of normotensive and DOCA-salt hypertensive rats. (a) Representative immunoblots; (b) Densitometric analysis of TH expression and its phosphorylated levels (Ser19p TH, Ser31p TH, Ser40p TH) in the left and right OB. Results are expressed as percentage of control ± SEM (% control). * p < 0.05, ** p < 0.01, and *** p < 0.001 vs. control; † p < 0.05, †† p < 0.01, and ††† p < 0.001 vs. DOCA-salt. Number of animals for each experimental group: 4.

