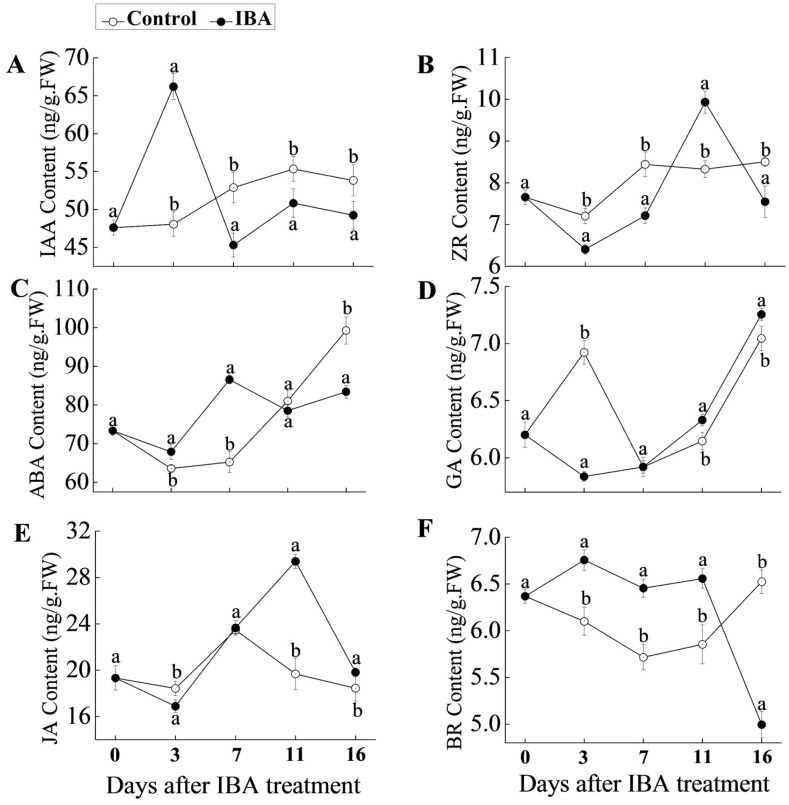
Figure 2.
Endogenous hormone levels in ‘T337’ basal cuttings after treatment with IBA and control for 0, 3, 7, 11, 16 days. (A) Auxin (IAA) content; (B) Zeatin riboside (ZR) content; (C) Abscisic acid (ABA) content; (D) Gibberellins (GA) content; (E) Jasmonic acid (JA) content; and, (F) Brassinolide (BR) content. Statistically significant differences in IBA-treated cuttings and control on each day are indicated with ‘a’ and ‘b’. Data shows the average values ± SE of three independent experiments.

