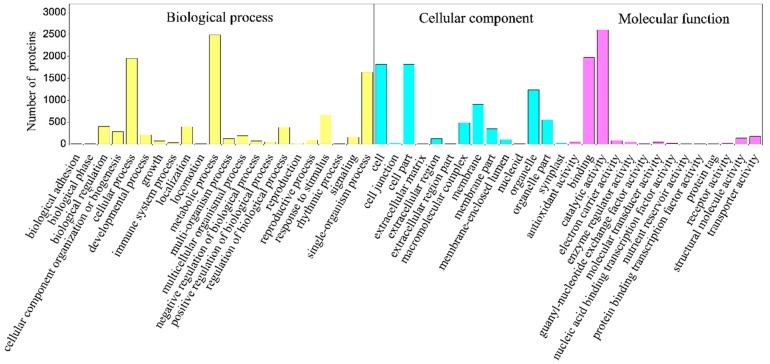
Figure 4.
Gene Ontology (GO) analysis of differently expressed proteins (DEPs) in IBA-treated apple cuttings, compared with untreated controls. Expressed proteins involved in molecular function, cellular component and biological process against the GO database. The X axis represents the Gene Ontology functional classification; The Y axis represents the number of differentially expressed proteins.

