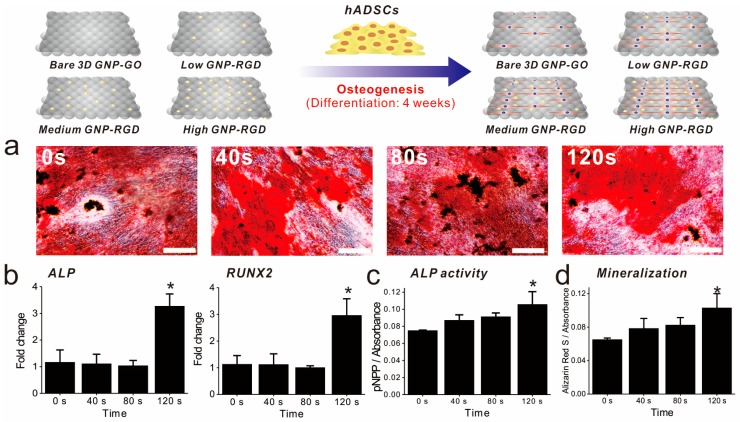
Figure 5.
Confirmation of ADSC osteogenic differentiation. (a) Alizarin Red S staining of all substrates. Scale bars = 200 μm; (b) RT-qPCR data for alkaline phosphatase (ALP), and RUNX2; (c) The ALP activity of each substrate; (d) Absorbance rates after Alizarin Red S (ARS) staining. * Student’s t-test, p < 0.05, n = 3.

