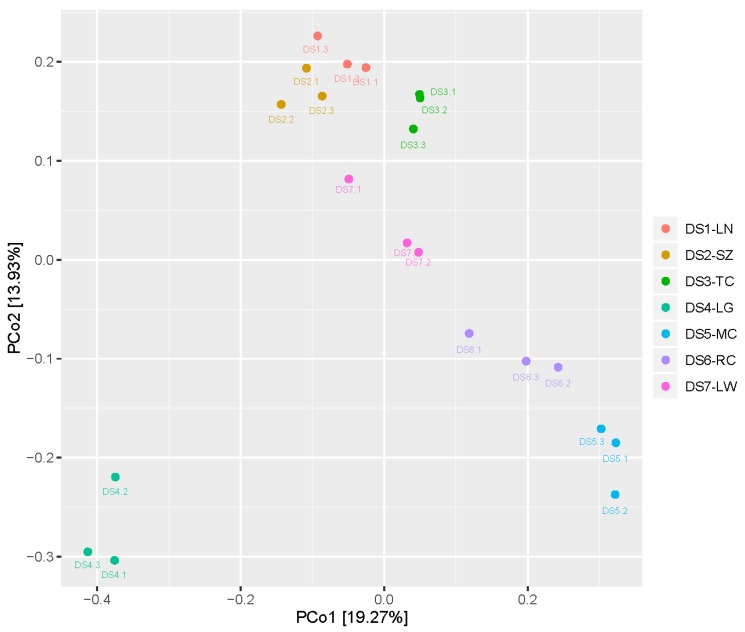
Figure 1.
Comparison of seed-associated bacterial microbiome with cultivated area (sampling geographic origins) by principal coordinates analysis (PCoA). PCoA plot is based on unweighted unifrac distance matrix of the 16S rRNA gene amplicons. The color of the symbols indicates samples with their IDs: pale red (DS1-LG, Luonan, Shaanxi, China), light brown (DS2-SZ, Shangzhou, Shaanxi, China), light green (DS3-TC, Tongchuan, Shaanxi, China), Wathet (DS4-LG, Langao, Shaanxi, China), blue (DS5-MC, Mianchi, Henan, China), purple (DS6-RC, Ruicheng , Shanxi, China), and pink (DS7-LW, Laiwu, Shandong, China).

