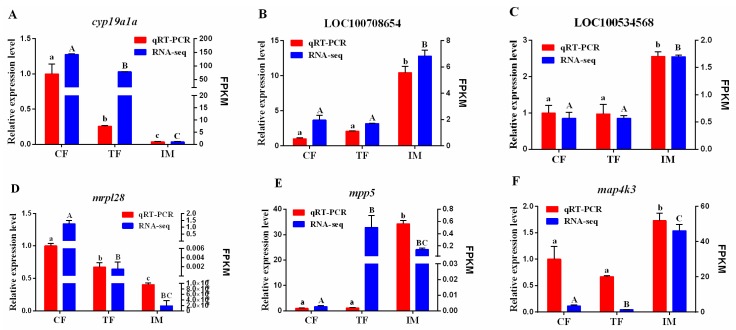
Figure 6.
qRT-PCR validation of RNA-Seq data. (A): cyp19a1a; (B): LOC100708654; (C): LOC100534568; (D): mrpl28; (E): mpp5; (F): map4k3. The left Y-axis represent the relative expression level determined by qRT-PCR, and the right Y-axis represent FPKM determined by RNA-Seq. The scales of the left and right Y-axis are different. All data represent the mean value of three biological replicates. Error bars represent the standard errors of three replicates. Different lowercase letters (in qRT-PCR) and capital letters (RNA-seq) show statistical significance between variables, according to one-way ANOVA and post-hoc Duncan’s multiple range tests (p < 0.05).

