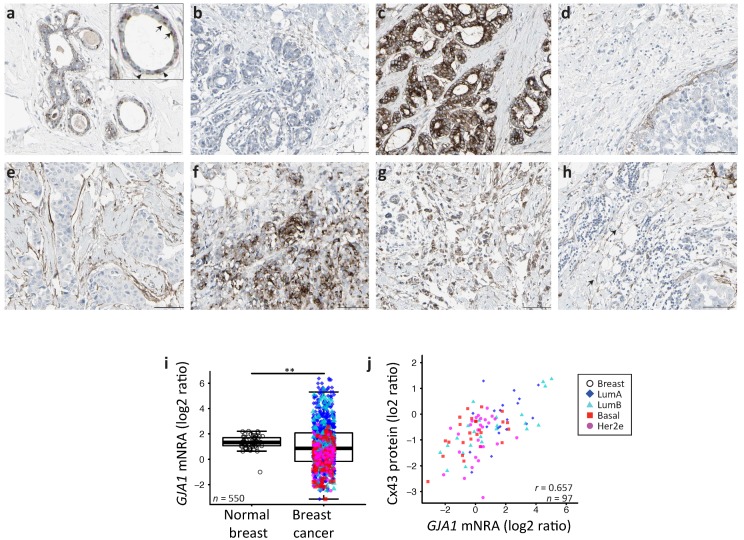
Figure 1.
(a–h) The Human Protein Atlas normal and breast cancer tissue staining by immunohistochemistry for Connexin 43 (Cx43) (CAB010753 antibody). (a) Normal breast. Insert: Arrow head: myoepithelial cell’s staining; arrow: luminal cell’s staining. (b–h) Breast cancer tissue, (h) arrow: staining of spindle shaped stromal cells. Scale bar = 100 m. (i) GJA1 mRNA expression in breast tumor vs. adjacent normal breast tissue in the The Cancer Genome Atlas (TCGA) dataset. p value: * <0.05; ** <0.01; *** <0.001. (j) Scatter plot showing Cx43 protein and GJA1 mRNA level in tumors. In the legend, “Breast” indicates adjacent normal breast tissue. Pearson’s correlation coefficient is given (r).

