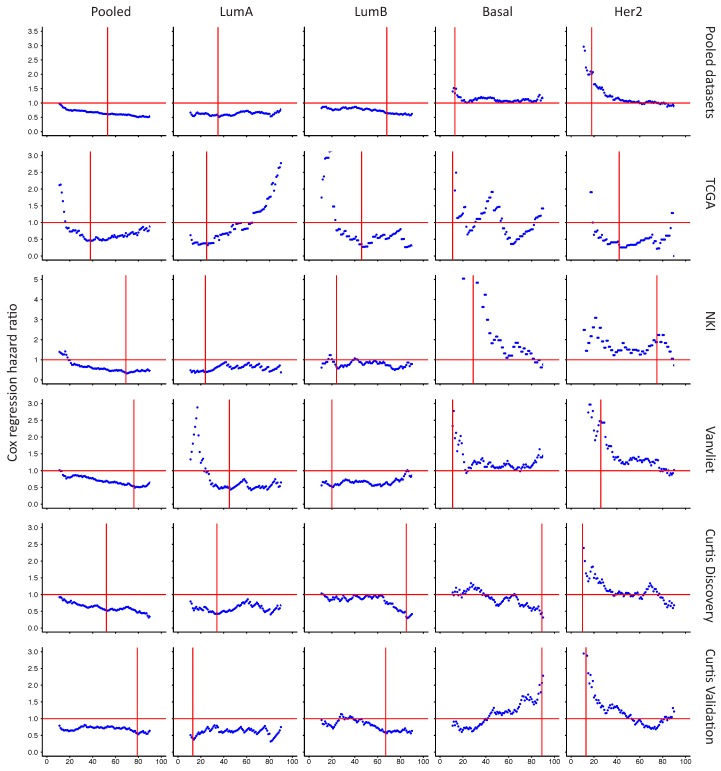
Figure A11.
Cox regression hazard ratio associated with GJA1 for different thresholds. Graph of the Cox regression hazard ratio to compare the survival of patients with Cx43 expressed at high or low levels according to varying thresholds (10–90 percentile). Horizontal red lines indicate a neutral hazard ratio of 1. Vertical red lines indicate the threshold with the lowest log rank test p value as determined in Figure A10, used for subsequent survival analysis. Results given for pooled tumors or individual breast cancer subtypes in our five datasets (TCGA, NKI, Vanvliet and Curtis discovery and Curtis validation) as well as in aggregated datasets (Pooled datasets).

