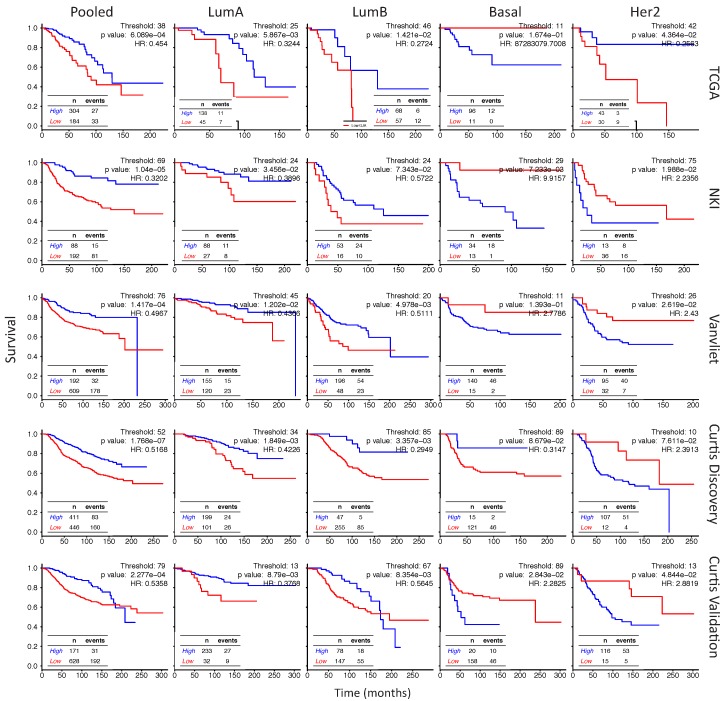
Figure A12.
Survival analysis of GJA1 in individual subtypes of breast cancer with the cutoff selected according to the log rank test p value. The Kaplan–Meyer plot shows survival curves for patients with breast tumors expressing either high (blue) or low (red) levels of GJA1 mRNA in pooled tumors or in individual intrinsic subtypes. TCGA, NKI, Vanvliet and both Curtis datasets were used separately for the analysis. The best cutoff was determined as the percentile lending the lowest log rank test p value as in Figure A10.

