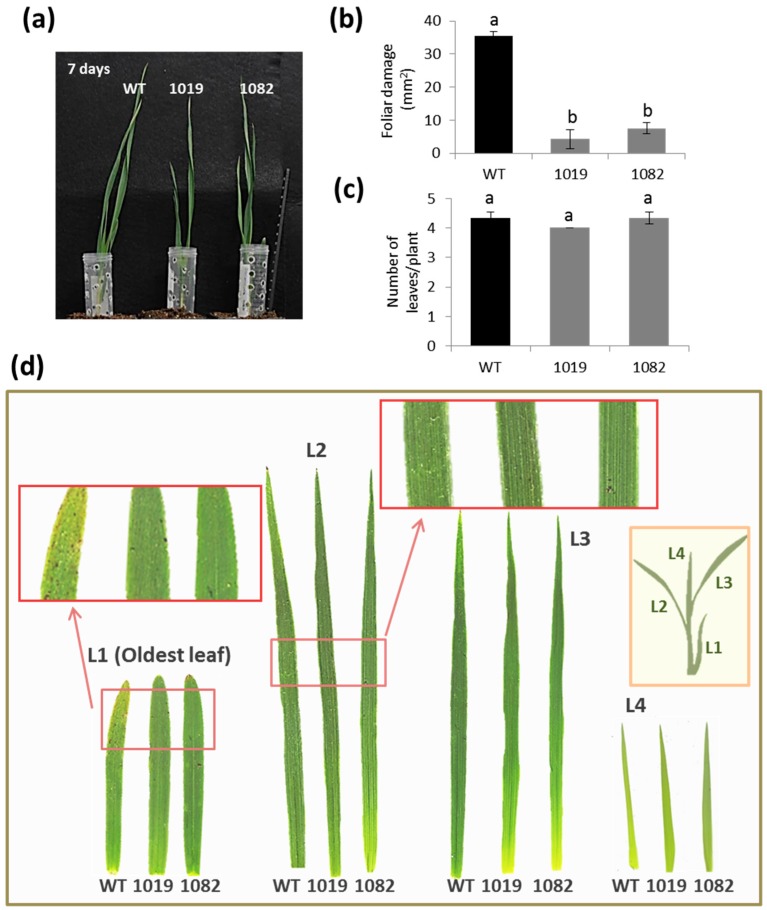
Figure 2.
Leaf damage in wild-type and OE Icy6 lines (1019 and 1082) after 7 days of T. urticae infestation. (a) Phenotypic aspect of the plants. (b) Quantification of leaf feeding damage. Damage was measured as mm2 of injured foliar area of all leaves. (c) Total number of leaves per plant. Data from six independent plants. Different letters (a,b) indicate significant differences (p < 0.05, One-Way ANOVA Student Newman-Keuls SNK test). (d) Examples of leaves from transgenic and non-transgenic plants, numbered from L1 (oldest leaf) to L4 (youngest leaf) at this stage of development. Regions of L1 and L2 leaves are magnified to highlight chlorotic spots due to mite feeding.

