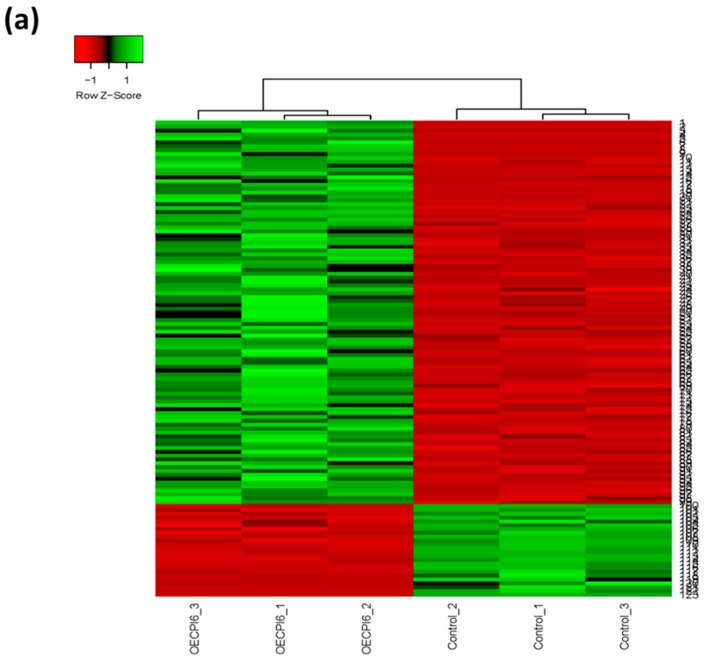
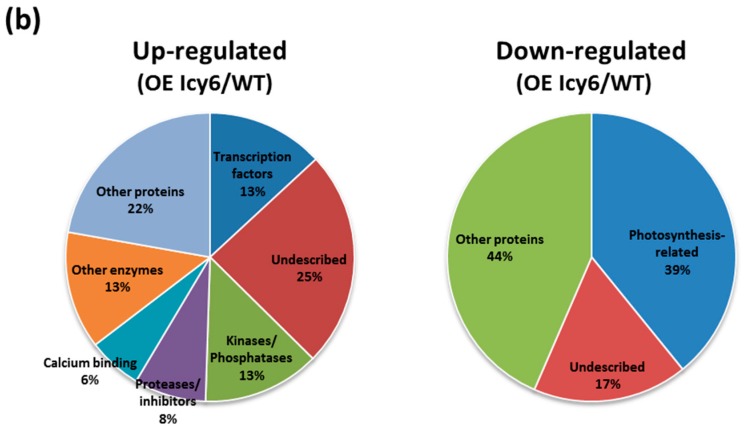
Figure 5.
Analysis of the differentially expressed genes (DEGs) among WT and OE Icy6 plants. (a) Heatmap showing normalized colour intensity from the expression values of the DEGs in the three independent replicates. Green represents up-regulation and red represents down-regulation. (b) Circle charts showing the percentage on up- or down-regulated DEGs for the main representative categories in each subset.


