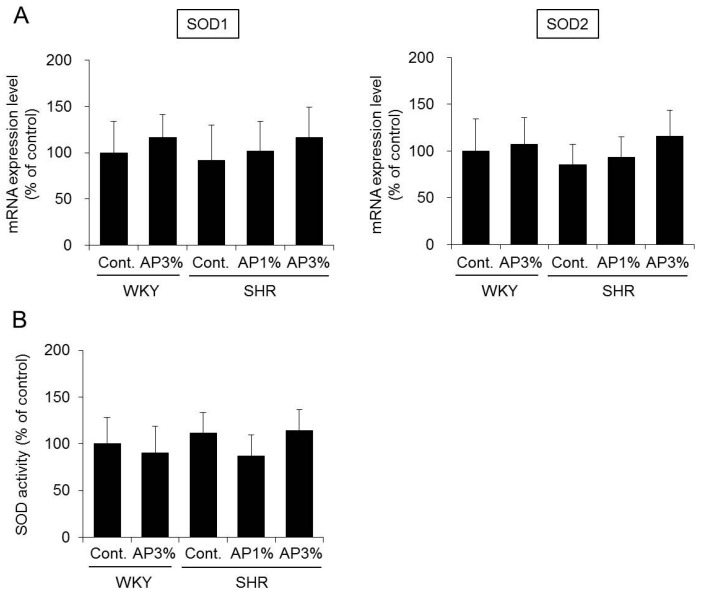
Figure 6.
SOD expression (A) and activity (B) in the kidney. A powdered diet containing AP or a diet without AP (control group) was fed to WKY and SHR. (A) The mRNA expression levels of SOD1 and SOD2 in the kidney were measured with real-time RT-PCR and normalized to 18S rRNA. (B): SOD activity in the kidney was measured. The results were obtained by setting the means of the control group to 100%. The data are presented as the means ± S.D. and were obtained from 5 rats per group.

