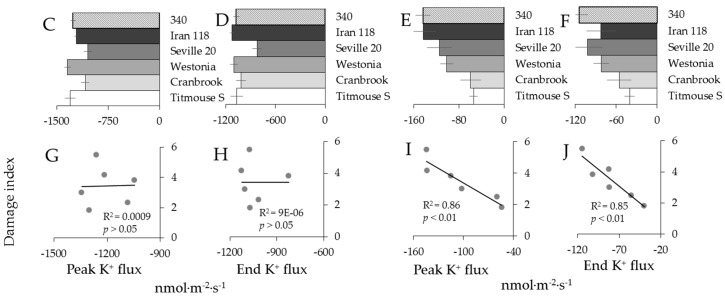
Figure 6.
Kinetics of K+ fluxes from three representative wheat varieties in response to 10 mM H2O2 treatment from both root elongation zone (A) and mature zone (B). Error bars are means ± SE (n = 6–8). (C,D,G,H) Peak (C) and end (D) K+ fluxes of six wheat varieties in response to 10 mM H2O2 and their correlation with damage index (G,H, respectively) in root elongation zone. (E,F,I,J) Peak (E) and end (F) K+ fluxes of six wheat varieties in response to 10 mM H2O2 and their correlation with damage index (I,J, respectively) in root mature zone.


