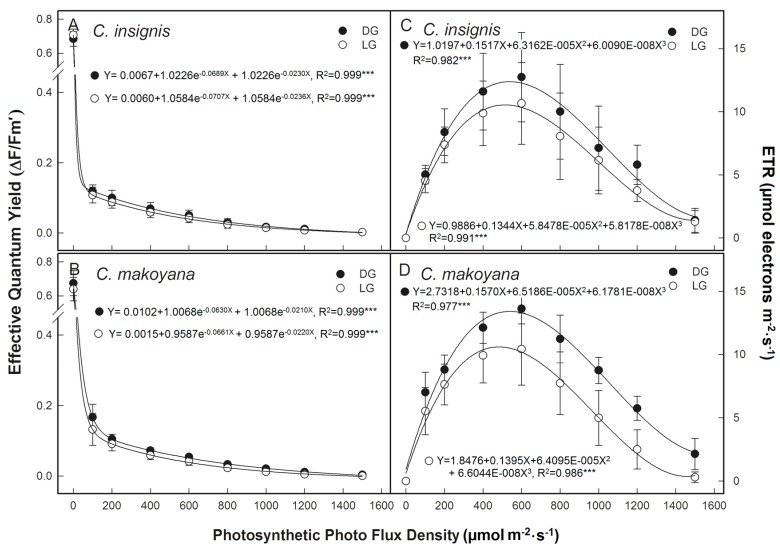
Figure 3.
Light response changes in effective quantum yield (ΔF/Fm’, (A,B)) and electron transport rate (ETR, (C,D)) from dark green leaf sector (black circle, DG) and light green leaf sector (white circle, LG) in Calathea makoyana and C. insignis. Vertical bars indicate the standard deviation (n = 5). *** p < 0.001.

