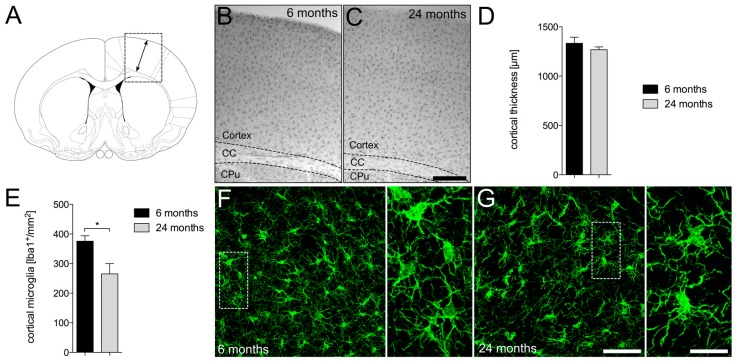
Figure 1.
Age-dependent changes in cortical microglia. (A) Orientation scheme monitoring cortical areas for evaluation. Arrows mark the area for cortical thickness measurements. Representative images of Iba1+ microglia in cortices from 6-month-old (B) and 24-month-old mice (C). Scale bar represents 300 µm. Quantifications of cortical thickness (D) and cortical Iba1+ microglia numbers (E) are shown. Data are given as means ± SEM from three animals per age. p-value derived from Student’s t-test is * p < 0.05. Differences in morphology and distribution of Iba1+ microglia between 6-month-old (F) and 24-month-old (G) mice. Scale bars indicate 20 µm in overview images and 7 µm in high magnification detail images. CC = corpus callsosum, CPu = caudatoputamen.

