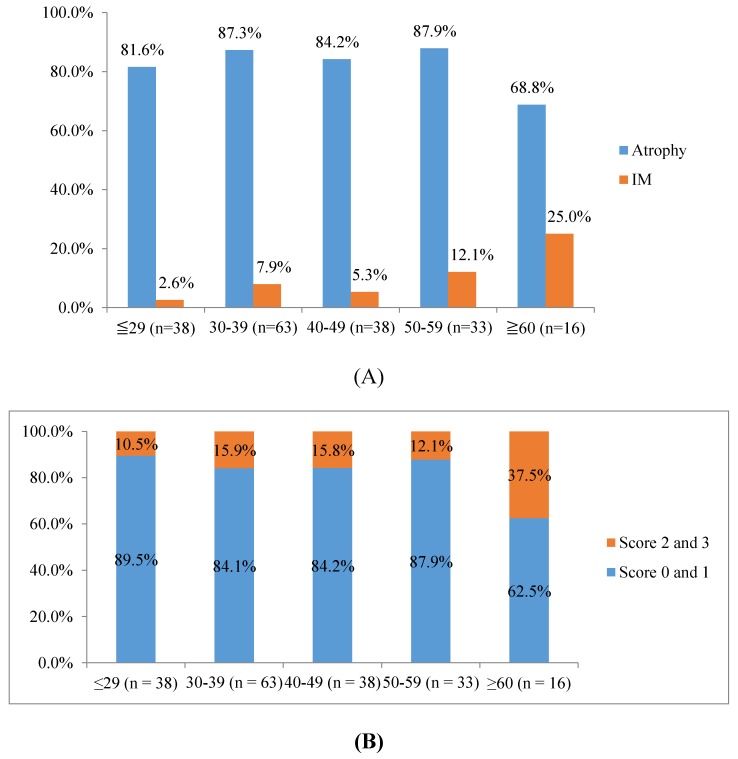
Figure 2.
H. pylori and histology. (A) The distribution of atrophic gastritis (atrophy) and intestinal metaplasia (IM) based on age groups within H. pylori infected subjects. (B) The distribution of OLGA score (high risk: OLGA 2 and 3, and low risk: OLGA 0 and 1) based on age groups within H. pylori-infected subjects.

