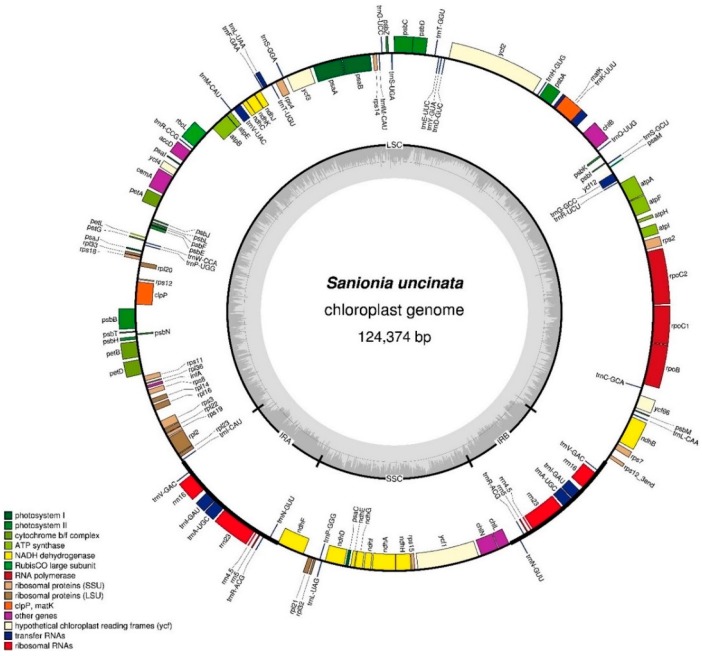
Figure 1.
Map of the Sanionia uncinata plastome. Complete plastome sequences were obtained from the de novo assembly of Illumina paired-end reads. Genes are color coded by functional group, which are located in the left box. The inner darker gray circle indicates the GC content while the lighter gray corresponds to AT content. IR, inverted repeat; LSC, large single copy region; SSC, small single copy region. Genes shown on the outside of the outer circle are transcribed clockwise and those on the inside counter clockwise. The map was made with OGDraw [31].

