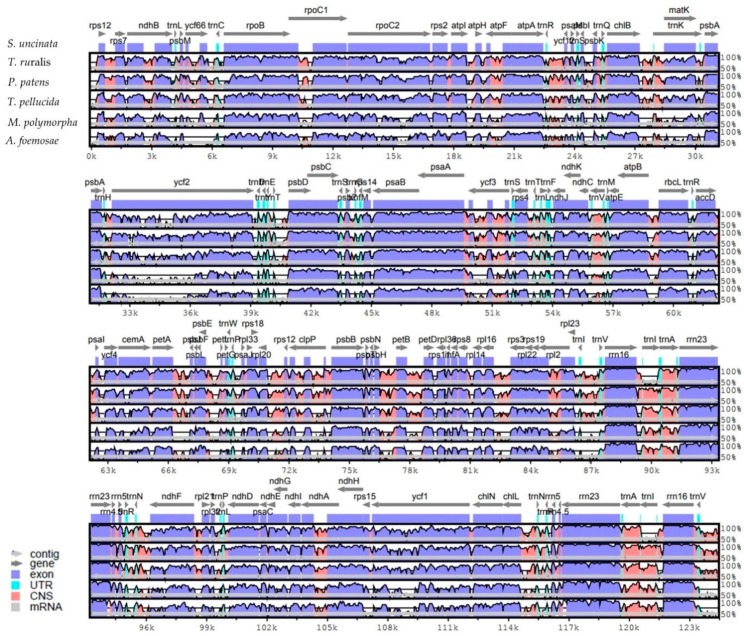
Figure 2.
Alignment of complete plastome sequences from six species. Alignment and comparison were performed using mVISTA and the percentage of identity between the plastomes was visualized in the form of an mVISTA plot. The sequence similarity of the aligned regions between S. uncinata and other five species is shown as horizontal bars indicating average percent identity between 50–100% (shown on the y-axis of graph). The x-axis represents the coordinate in the plastome. Genome regions are color-coded for protein-coding (exon), rRNA, tRNA and conserved non-coding sequences (CNS) as the guide at the bottom-left.

