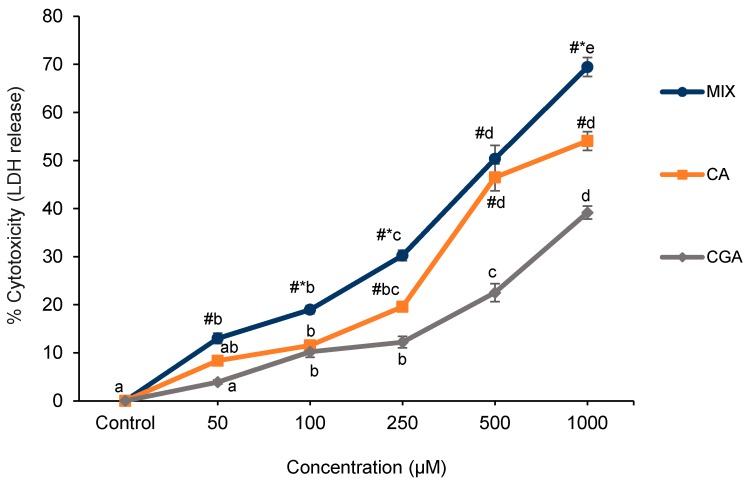
Figure 3.
Effect of treatment with different doses of CGA, CA and MIX for 24 h on Caco-2 cell cytotoxicity as evaluated by the LDH assay. Data are represented as mean ± SE. Statistical analysis was performed via two-way ANOVA using treatment and dose as factors. Doses within the same treatment not sharing common letters are significantly different (p < 0.05). The symbol # represents a significant difference (p < 0.05) between CGA and either of the two other treatments at a specific dose. The symbol * represents a significant difference (p < 0.05) between MIX and CA at a specific dose. CGA = chlorogenic acid; CA = caffeic acid; MIX = equimolar mixture of the four tested compounds; LDH = lactate dehydrogenase.

