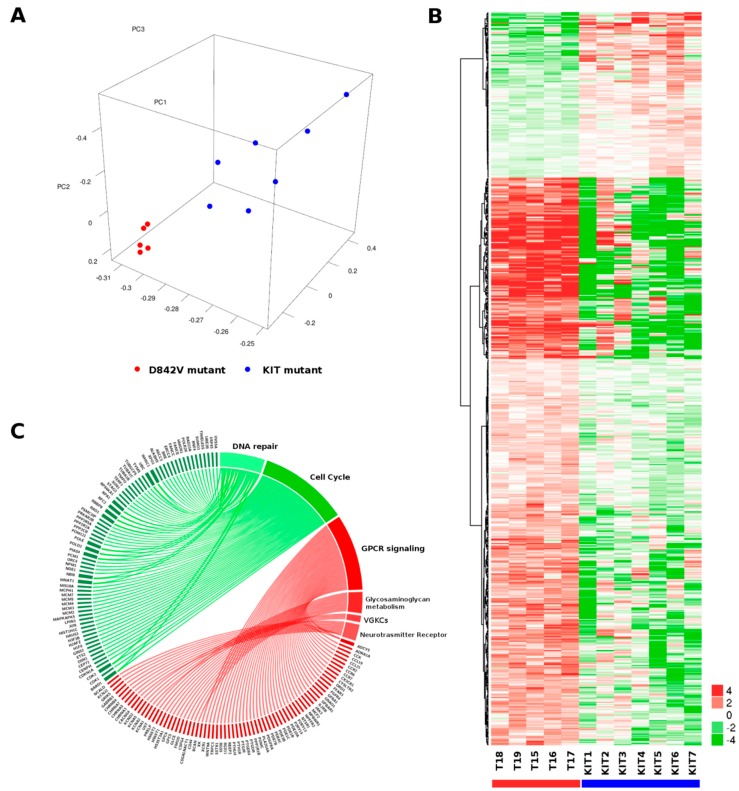
Figure 1.
Transcriptome profile of D842V mutant versus KIT mutant GIST. (A) Principal component analysis performed on the whole set of expressed genes (n = 15,134) shows a very uniform profile of D842V mutant tumors (red dots) that is distinctly separated from KIT mutant GIST (blue dots); (B) Heatmap of 494 overexpressed and 144 downregulated genes in D842V GIST; hierarchical clustering was performed to groups genes adopting Manhattan distance and Ward method; (C) Graphical representation of genes and pathways emerging as enriched (red) or depleted (green) in D842V mutant GIST. Genes and the corresponding pathways are also reported in Supplementary Table S2.

