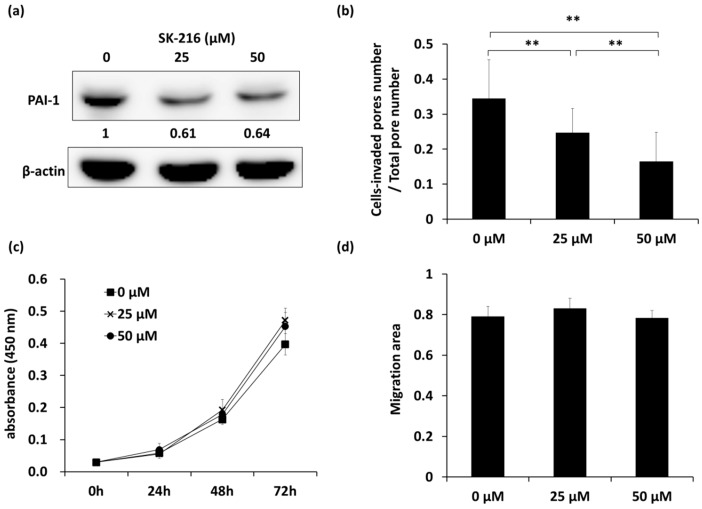
Figure 1.
The PAI-1 inhibitor SK-216 suppresses invasion with no influence on proliferation or migration of 143B cells. (a) Western blot analyses of PAI-1 expression in SK-216 treated 143B cells. PAI-1 expression was quantified using Image Studio Lite (LI-COR) and normalized to β-actin. Expression is shown relative to that in non-treated cells (0 μM); (b) Matrigel assay of the invasion of SK-216-treated cells. The ratio of the number of pores containing invading cells to the total number of all pores is shown. Bar graphs show means ± SD ** p < 0.01; (c) Proliferation assay indicating absorbance (450 nm) measured at 0, 24, 48, or 72 h after SK-216 treatment for 143B cells is shown (n = 5 wells per group); (d) Scratch assay of the migration of 143B cells after 48 h treatment of SK-216. The migrated areas were analyzed at about 30 h after being scratched. Bar graphs show means ± SD.

