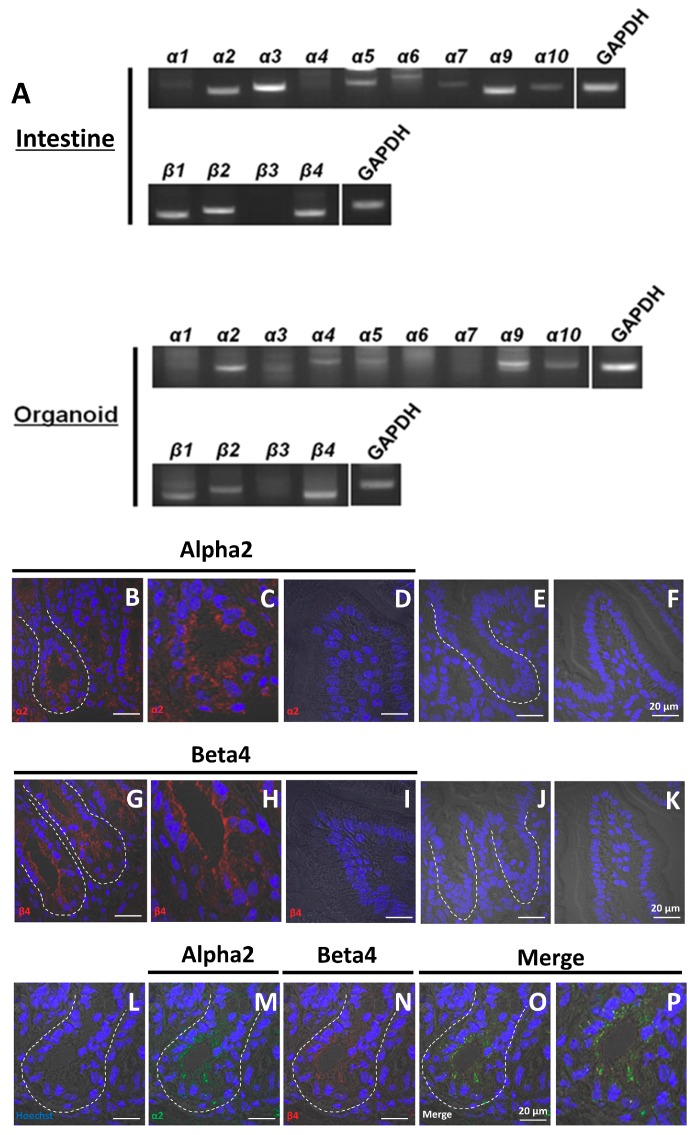
Figure 1.
Localization of nAChR subunits in the mouse small intestine and organoids. (A) RT-PCR analysis of the expression of nAChR subunits in intestine and cultured organoids (passage 5); (B,D) visualization of α2 (red) in crypts and villus; (E,F) control sections labeled with secondary antibody [Alexa Fluor 546 donkey anti-(rabbit IgG)] in the absence of primary antibody; (G,I) visualization of β4 (red) in crypts and villus; (J,K) control sections labeled with secondary antibody [Alexa Fluor 568 rabbit anti-(goat IgG)] in the absence of primary antibody; (L–O) co-localization of α2 and β4 in crypts; (M) visualization of α2 (green) in crypts; (N) visualization of β4 (red) in crypts; (O) merged visualization of (L), (M), and (N). (C,H,P) Enlargement of (B), (G), and (O). White dotted lines indicate the crypt region. In all panels, nuclei were stained with Hoechst 33342 (blue). Bars in (B–P) except for (C), (H), and (P) represent 20 μm.

