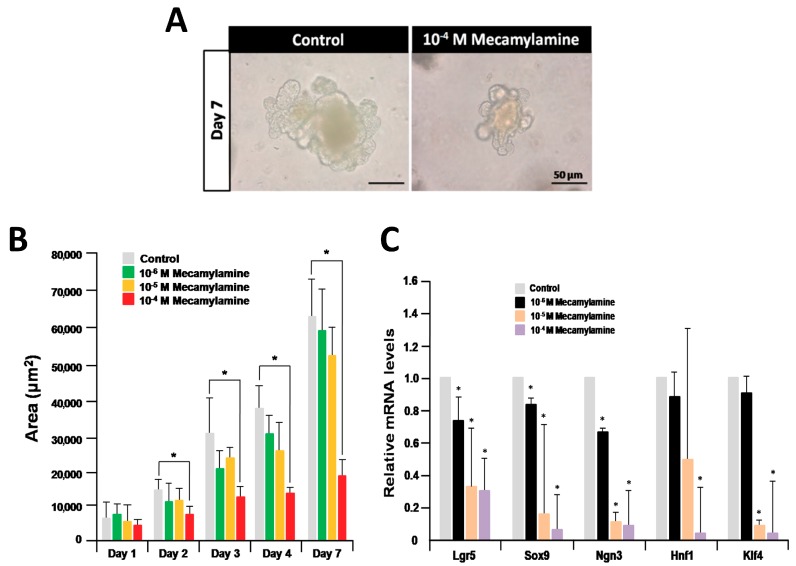
Figure 2.
Effect of mecamylamine on organoid growth and differentiation. (A) Micrographs of organoids after treatment with 10−4 M mecamylamine for seven days of culture; (B) effect of mecamylamine on the size of cultured organoids. Each sample represents an average of three independent experiments. Error bars represent the standard deviation (SD) of the mean. An asterisk indicates a statistically significant difference from untreated control organoids (Mann–Whitney test, * p < 0.05). (C) Relative quantification of marker genes after treatment with mecamylamine for seven days. The results are based on three independent experiments and are expressed as mean values ± SD. The statistical significance was calculated with Student’s t-test (* p < 0.05 as compared with control).

