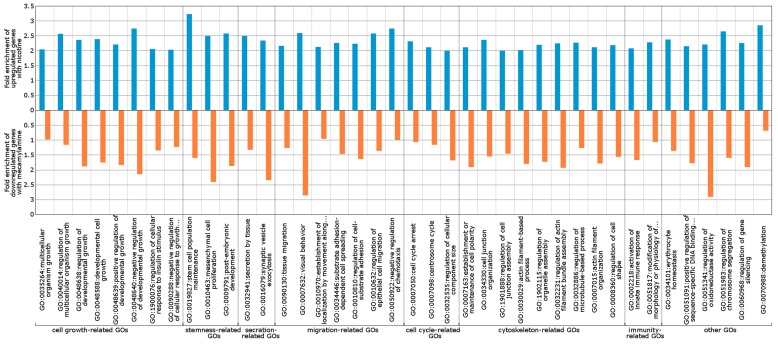
Figure 3.
Classification of genes upregulated in response to nicotine and downregulated in response to mecamylamine. Bio-process gene ontology (GO) terms of the differentially expressed genes were mapped by DAVID analysis. Bar graphs show the Fold enrichment score output from DAVID analysis. The blue bar and upper axis indicate fold-enrichment scores for upregulated genes with nicotine and the orange bar and lower axis indicate fold enrichment scores for downregulated genes with mecamylamine.

