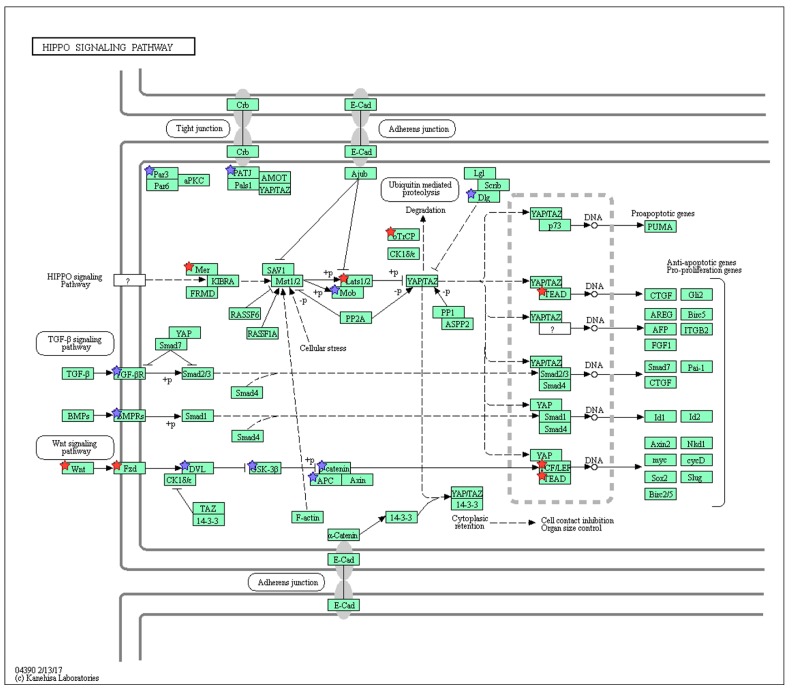
Figure 5.
Hippo signaling pathway (mmu04390) maps derived from DAVID analysis. Green boxes and arrows indicate the genes and interactions in the pathway. +p and −p denote phosphorylation and dephosphorylation, respectively. The genes with red stars are those that were upregulated with nicotine treatment and downregulated with mecamylamine. Additionally, the genes with blue stars represent those that were upregulated by nicotine and not downregulated with mecamylamine treatment.

