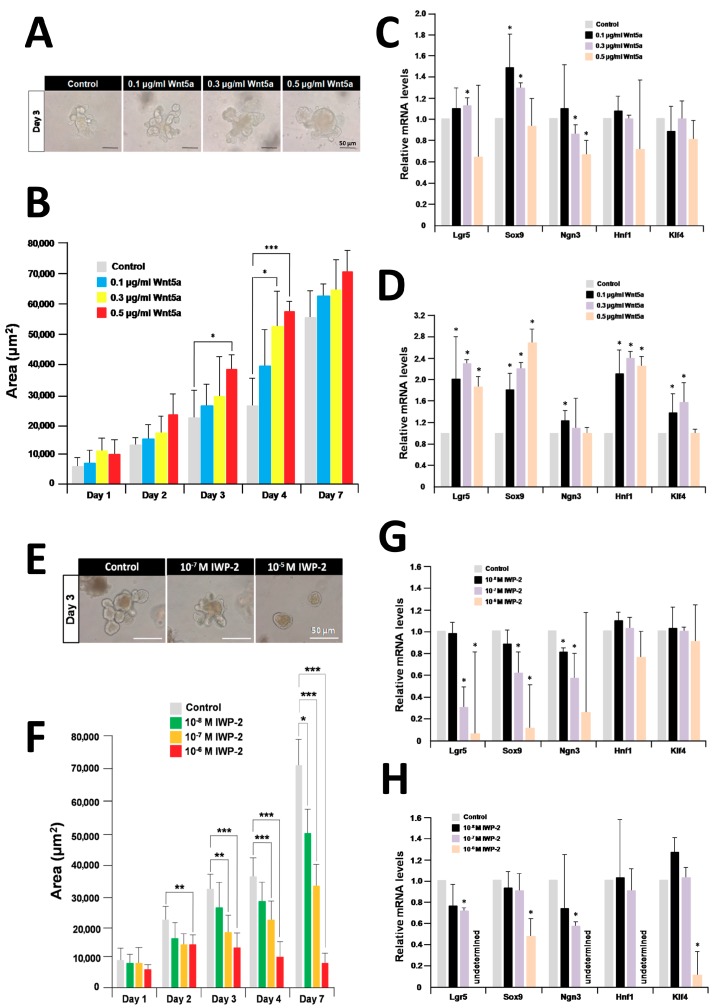
Figure 7.
Effects of recombinant Wnt5a and IWP-2 on organoid growth and differentiation. (A) Micrographs of organoids after treatment with 0.1 μg/mL, 0.3 μg/mL, and 0.5 μg/mL recombinant Wnt5a for three days of culture; (B) effect of recombinant Wnt5a on the size of cultured organoids; (C) relative quantification of marker genes after treatment with recombinant Wnt5a for three days; (D) relative quantification of marker genes after treatment with recombinant Wnt5a for seven days; (E) micrographs of organoids after treatment with 10−7 M and 10−5 M IWP-2 for three days; (F) effect of IWP-2 on the size of cultured organoids; (G) relative quantification of marker genes after treatment with IWP-2 for three days; (H) relative quantification of marker genes after treatment with IWP-2 for seven days; (B,F) each sample represents an average of three independent experiments. Error bars represent the SD of the mean. An asterisk indicates a statistically significant difference from untreated control organoids (Mann–Whitney test, * p < 0.05, ** p < 0.005, and *** p < 0.0005). (C,D,G,H) The results are based on three independent experiments and expressed as mean values ± SD. An asterisk indicates a statistically significant difference from untreated control organoids (Student’s t-test, * p < 0.05).

