Figure 9.
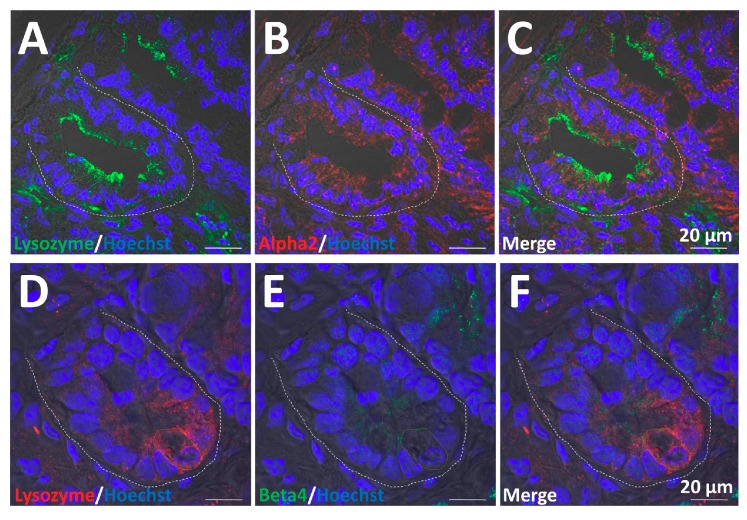
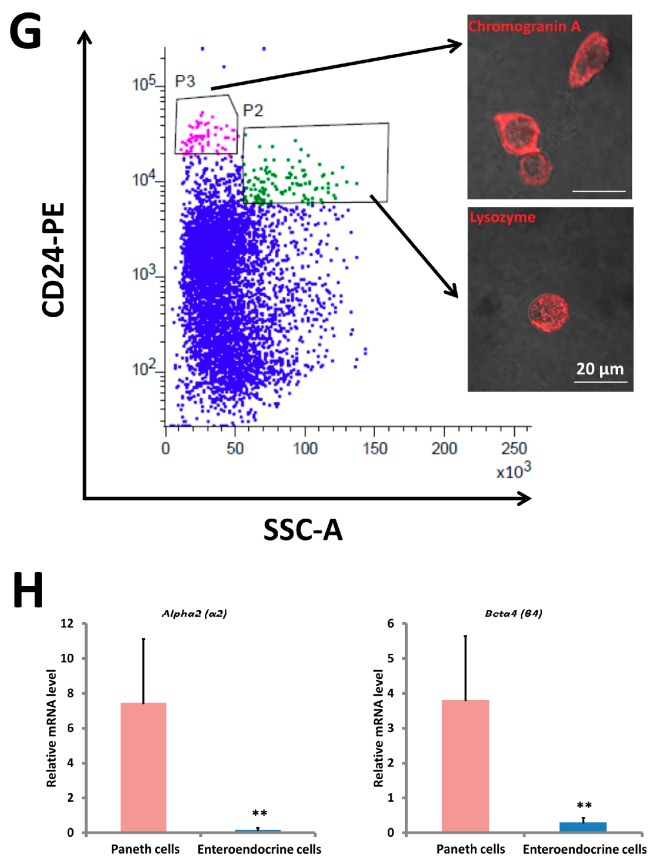
Co-localization and gene expression of α2 and β4 in Paneth cells. (A) Visualization of lysozyme (green) in crypts; (B) visualization of α2 (red) in crypts; (C) merged visualization of (A) and (B); (D) visualization of lysozyme (red) in crypts; (E) visualization of β4 (green) in crypts; (F) merged visualization of (D) and (E). White dotted lines indicate the crypt region. Orange dotted lines indicate the typical cell. In all panels, nuclei were stained with Hoechst 33342 (blue). Bars in (A–F) represent 20 μm. (G) FACS plot of dissociated single cells from organoid tissues. Two CD24 bright populations differ by side-scatter (SSC) pattern. Sorted CD24 high/SSC low (P3) and CD24 high/SSC high (P2) cells are subsequently stained. CD24 high/SSC low cells are positive for the enteroendocrine marker chromogranine A (top right), whereas CD24 high/SSC high cells are positive for the Paneth marker lysozyme (bottom right). (H) CD24 high/SSC high (P2) and CD24 high/SSC low (P3) cells were examined for transcripts of α2 (Alpha2) and β4 (Beta4) with quantitative RT-PCR. The results are based on three independent experiments as mean values ± SD. The statistical significance was calculated with Student’s t-test (** p < 0.005).


