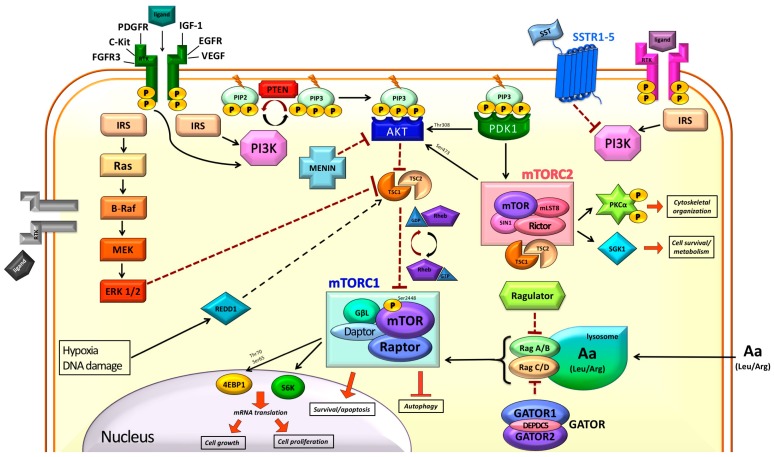
Figure 1.
Schematic representation of the phosphoinositide-3-kinase (PI3K)/protein kinase B (AkT)/ mechanistic target of rapamycin (mTOR) pathway. Black arrow: direct activation; Dotted black arrow: activation through unknown/not diasplayed other molecules; Dotted T bar: inhibition; Black/red twisting arrows: activation/inactivation conversion; Red arrow: promotion of processes; Red T bar: inhibition of processes; P in yellow spheres: phosphate group.

