Figure 1.
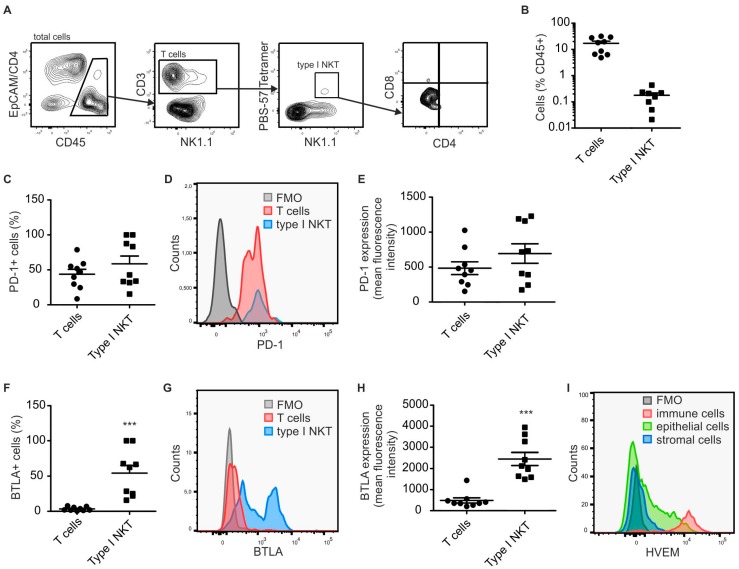
Type I NKT cells express high levels of BTLA in PyMT tumors. PyMT tumors (n = 9) were harvested and single cell suspensions were analyzed by flow cytometry. (A) Gating strategy used to identify total CD3+ T cells and PBS-57-CD1d tetramer reactive type I NKT cells in PyMT tumors. (B) The relative abundance of total CD3+ T cells and PBS-57-CD1d tetramer reactive type I NKT cells in the total CD45+ immune cell pool in PyMT tumors is shown. Data are means + SEM. (C–E) Relative abundance (C); and expression levels (D,E) of PD-1 on T cell populations are displayed. (F–H) Relative abundance (F); and expression levels (G,H) of BTLA on T cell populations are displayed. (I) Representative FACS histogram showing the expression of HVEM on different cells in PyMT tumors. p-values were calculated using two-tailed Student’s t test, *** p < 0.001.

