Figure 3.
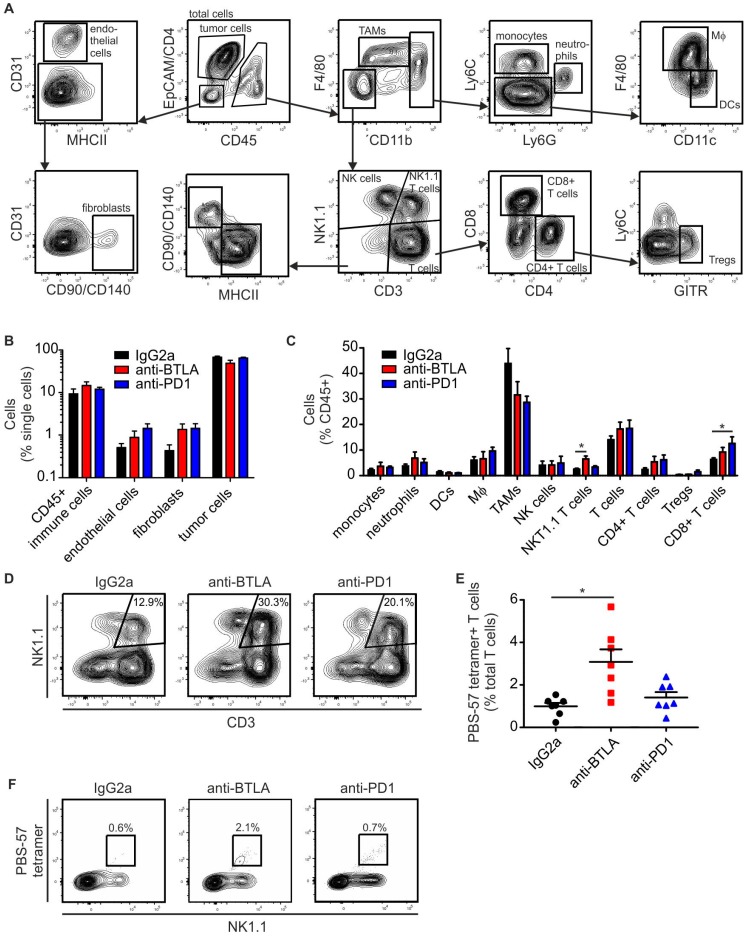
Anti-BTLA antibodies increase tumor infiltrating NKT cell numbers. PyMT tumors were treated with 5 mg/kg of each anti-BTLA, anti-PD-1 or isotype control (IgG2A) antibodies (n = 7 each) twice weekly for three weeks once the first tumor reached a size of 0.5 cm in diameter. Tumors were harvested for FACS analysis 21 days after initial treatment. (A) Representative FACS plots show gating strategy to identify cellular subsets in PyMT tumors. (B) The relative abundance of tumor cells, CD45+ immune cells, fibroblasts and endothelial cells in the total single cell population is shown. (C) The relative abundance of myeloid and lymphoid cell subsets within total CD45+ cells is displayed. (D,E) The graph indicates the relative abundance of PBS-57-CD1d tetramer reactive type I NKT cells. (F) Representative FACS plots indicate the expansion of PBS-57-CD1d tetramer reactive type I NKT cells upon anti-BTLA treatment. p-values were calculated using one-way ANOVA with Bonferroni’s correction, * p < 0.05.

