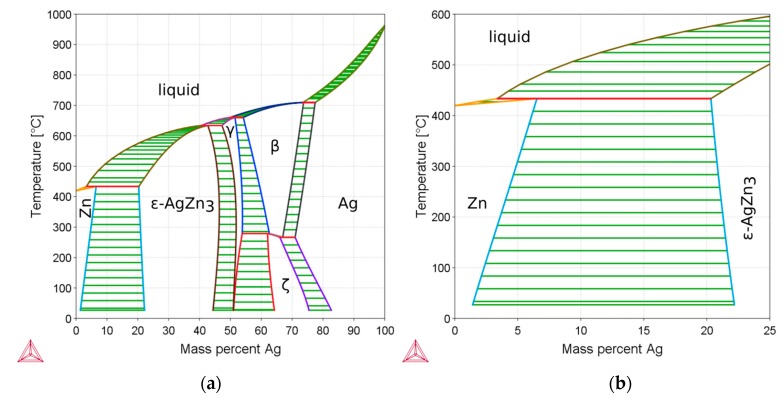
Figure 1.
(a) Calculated Zn-Ag phase diagram using the Themo-Calc 2017a software (Thermo-Calc Software AB, Solna, Sweden) and the SNOB-3 database. (b) Detail of the phase diagram in (a) manifesting that up to 6 wt % Ag can be solved in Zn. Upon cooling, the composition enters the two-phase area, i.e., precipitations of ε-AgZn3 in the Zn matrix occur. As this effect is generally accompanied by an increase in strength, it is referred to as precipitation hardening.

