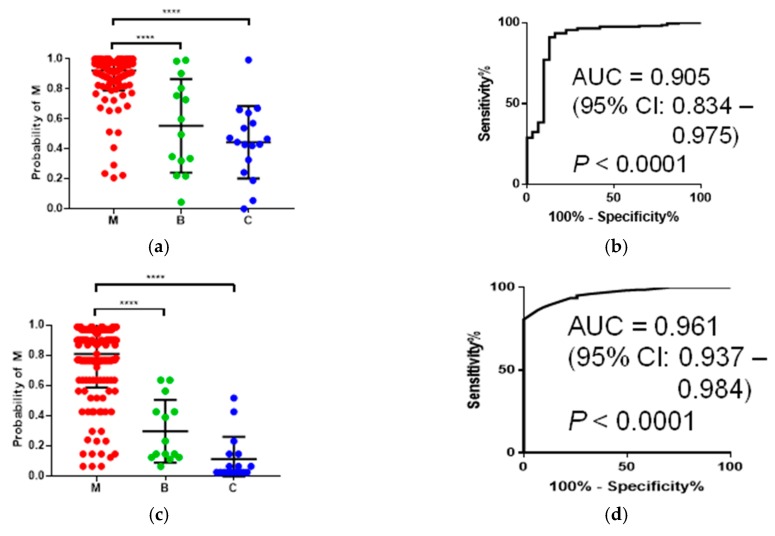
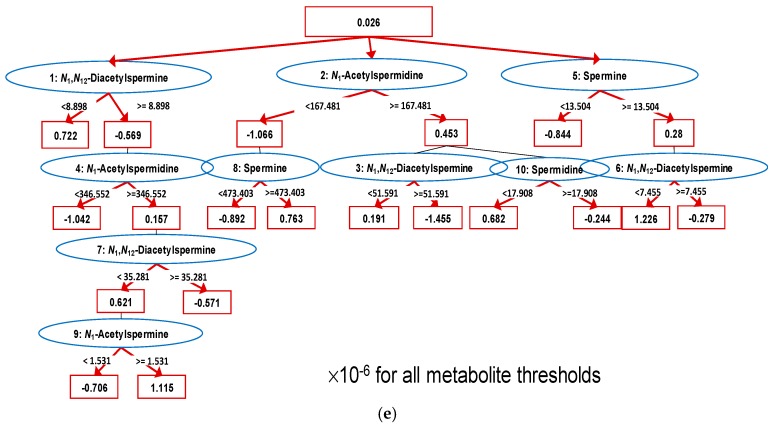
Figure 3.
Discrimination abilities of mathematical models. (a) Distribution of predicted probabilities of malignancy (M) calculated by multiple logistic regression (MLR) and (b) its ROC curve. (c) Distribution of predicted probability of the ADTree model and (d) its ROC curve. (e) The ADTree model to discriminate M (n = 201) from B + C (n = 31). Total scores <0 and >0 indicated the higher and lower probability of M. All values of the thresholds in this tree should be ×10−6 to calculate the probability of M. p-values of (a) and (c) were calculated using the Kruskal–Wallis test with Dunn’s post-test. **** p < 0.0001.


