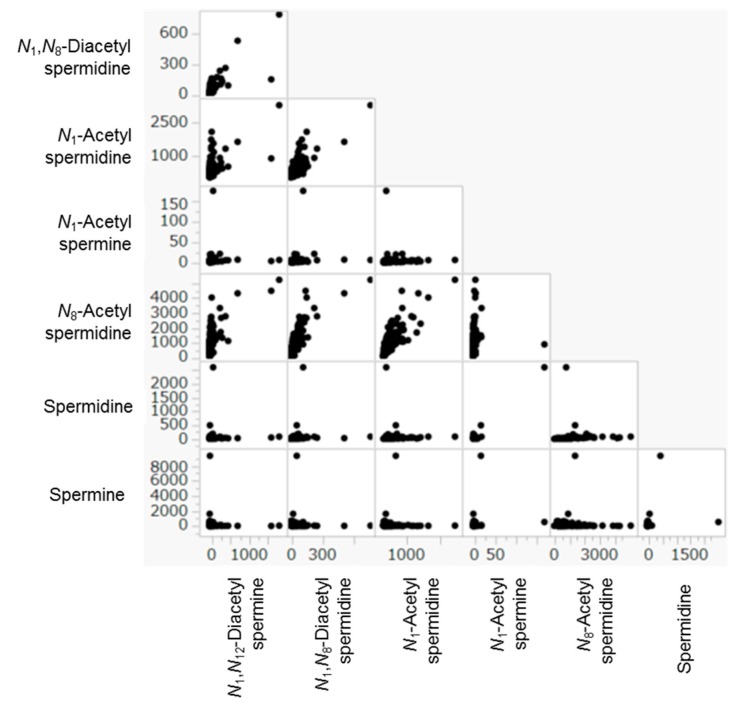
Figure 4.
The correlation among urinary polyamines. Each dot indicates quantified data in a sample. Both the X and Y axis had no unit, since each metabolite concentration was divided by the creatine concentration. The correlation coefficients were listed at Table 4.

