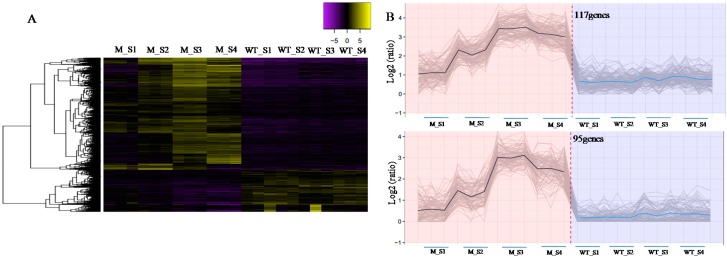
Figure 7.
Clustering of DEGs between WT and m68 at different leaf senescence stages. (A) Hierarchical clustering of all DEGs; (B) The two subclusters represent 27 subclusters which had increased expression pattern in m68 and unchanged expression pattern in WT during leaf development. Gray lines show the relative expression levels of DEGs in the subcluster in WT and m68 at different leaf senescence stages. Black lines and Blue lines show the average values for relative expression in each subcluster. X-axis indicates m68 and WT at different leaf senescence stages. Y-axis indicates the relative expression level.

