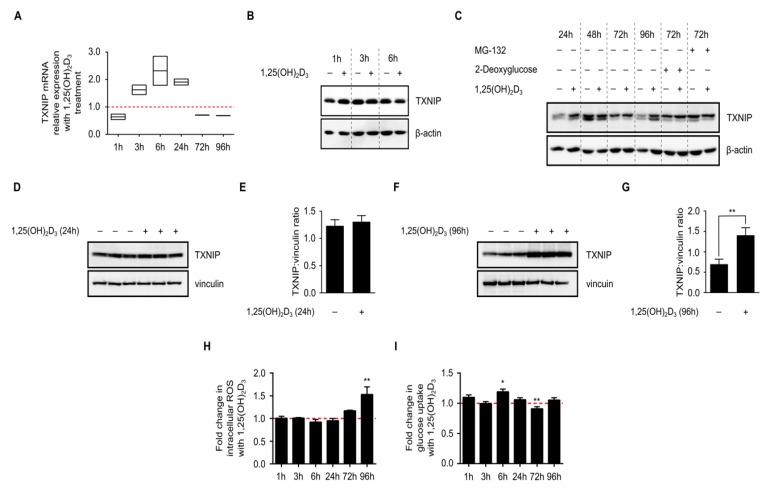
Figure 2.
Time-dependent regulation of TXNIP expression and associated cellular processes in HL-60 cells by 1,25(OH)2D3. (A) 1,25(OH)2D3 (100 nM) induced a transient increase in TXNIP mRNA levels that was diminished at later time points. The dashed red line indicates the baseline TXNIP mRNA expression in DMSO-treated cells set to 1; (B,C) Immunoblot showing TXNIP protein levels in response to 1,25(OH)2D3; induction is observed after 24 h and also after 96 h of treatment. Basal TXNIP levels exhibit temporal fluctuations, independent of treatment. Treatment with 2-deoxyglucose (10 mM), a potent inducer of TXNIP expression, and MG-132 (5 µM), a proteasomal inhibitor to prevent degradation, were used as positive controls. The compounds were added into the conditioned medium of DMSO- and 1,25(OH)2D3-treated HL-60 cells either 24 h (2-deoxyglucose) or 6 h (MG-132) before the end of the initial treatment period. “+” and “−” denote the presence or absence of the indicated molecule/treatment, respectively; (D) Immunoblot and (E) densitometric quantification of TXNIP protein levels after 24 h of treatment of HL-60 cells with 1,25(OH)2D3 indicate a mild increase in TXNIP level, which lacks statistical significance; (F) Immunoblot and (G) densitometric quantification after 96 h of treatment of HL-60 cells with 1,25(OH)2D3 showing a statistically significant induction of TXNIP levels; (H) Intracellular ROS levels, presented as fold change of treated vs. control cells, were found to be significantly induced by 1,25(OH)2D3 only at the latest time point (96 h). The dashed red line indicates the baseline ROS level in DMSO-treated cells set to 1; (I) Glucose uptake, which is known to be inhibited by TXNIP, was found to be significantly induced by 1,25(OH)2D3 at an early time point (6 h), and reduced at a later one (72 h). Baseline glucose uptake level in DMSO-treated cells is indicated by the dashed red line set to 1. Statistical significance was calculated using a two-tailed Student’s t-test. p-Values less than or equal to 0.05 and 0.01, are depicted by * and **, respectively. Error bars ± SD; n = 3.

