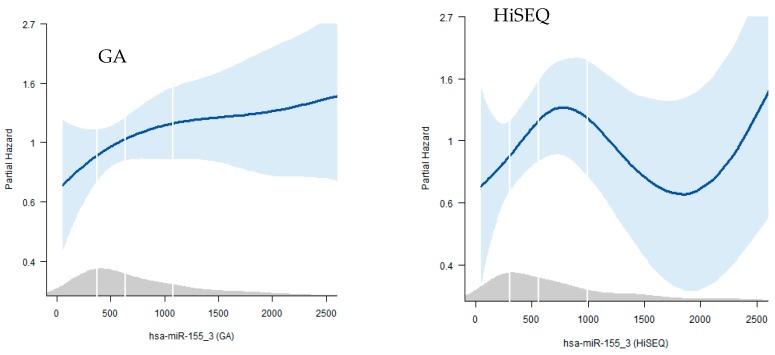
Figure A1.
The visual representation of the Cox multivariate analyses, showing the continuous relationship between the expression of mir-155 and risk, adjusted for age, sex, histological grade and cancer stage. The white lines indicate the 1st, 2nd, 3rd and 4th quartile of gene expression. The figure on the left was generated with data from the GA dataset, the figure on the right was generated with data from the HiSeq dataset.

