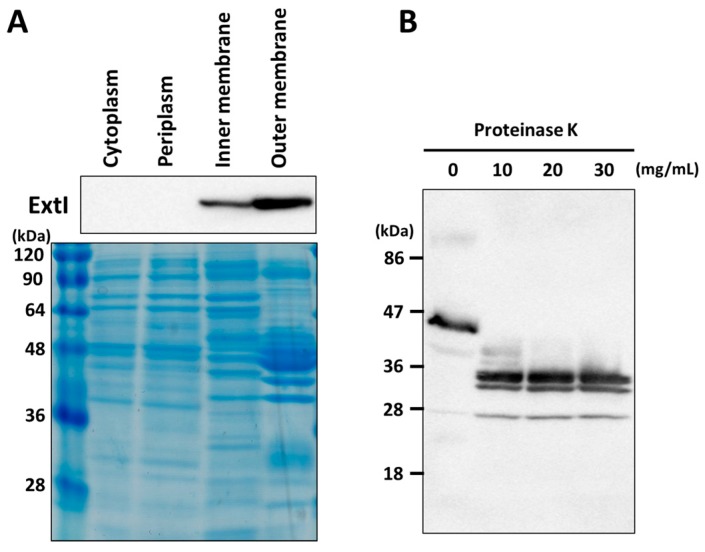
Figure 2.
Cellular localization of ExtI. (A) Subcellular fractionation and Western blotting. Each cellular fraction was isolated, and the localization of ExtI was analyzed by Western blotting (upper panel). A Coomassie-stained gel is shown as the loading control (lower panel). The numbers at the left indicates the sizes of the marker proteins in kDa; (B) the effects of proteinase K treatment on ExtI integrity. Cells were treated with different concentrations (0 to 30 mg/mL) of proteinase K to analyze the surface exposure of ExtI, and the degraded products were analyzed by Western blotting.

