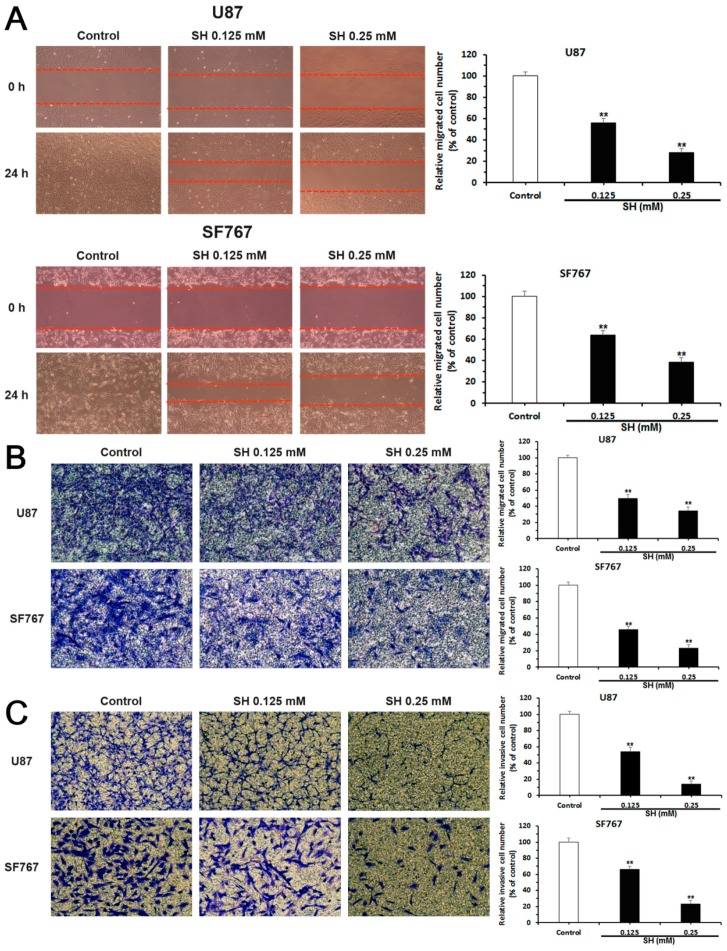
Figure 2.
Effects of SH on the migration and invasion of human glioblastoma cells in vitro. U87 and SF767 cells were treated with SH (0.125, 0.25 mM) for 24 h. (A) Results and statistical analysis of wound healing assays for U87 and SF767 cells. The red dotted lines represent the locations of cell migration to the wounded area; (B) Results and statistical analysis of Transwell migration assays for U87 and SF767 cells; and (C) results and statistical analysis of matrigel-coated Transwell invasion assays for U87 and SF767 cells. All images were captured at 100× magnification. Each image is representative of n = 3 experiments. All data are presented as means ± SEM, n = 3. ** p < 0.01 compared with the control.

