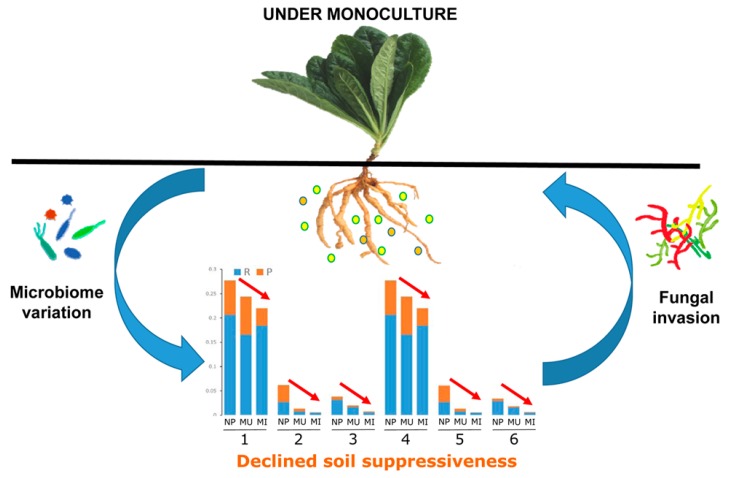
Figure 6.
Schematic representation of the proposed interactions between root-associated microbes and R. glutinosa under consecutive monoculture. NP, MU, and MI represent the newly planted, monocultured uninfected and infected plants, respectively. R and P represent rhizosphere and rhizoplane soils, respectively. 1~6 represent the families of Pseudomonadaceae, Bacillaceae, and Micrococcaceae, and the genera of Pseudomonas, Bacillus, and Arthrobacter, respectively. Color circles represent root exudates released by R. glutinosa. Red arrows indicate the sum of above-mentioned taxa (1~6) gradually decreased with extended monoculture.

