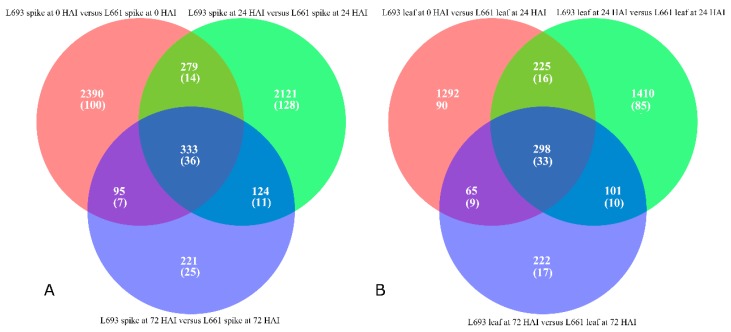
Figure 5.
Venn diagram showing the number of differentially expressed genes shared by L693 and L661 at 0 h (red), 24 h (green), and 72 h (blue) after inoculation for the spike (A) and leaf (B). The numbers without parentheses represent the differentially expressed genes across the whole genome; the numbers in parentheses represent the differentially expressed genes on wheat chromosome 3B.

